雅思写作小作文梳理海量数据的方法
以2019年11月30日官考真题为例:

信息分组原则:
1、找“最”值;
2、发现区别大小;
3、稳定性比较。
教师示范:
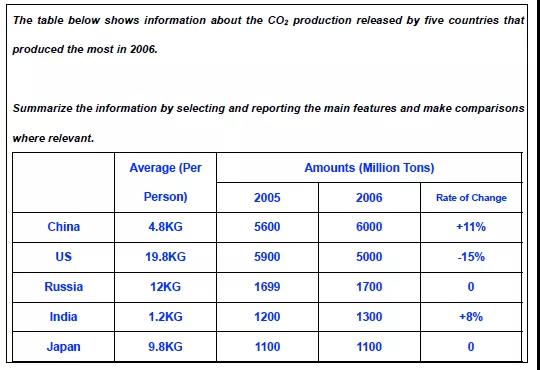
The table is a statistical presentation of the CO2 production in five countries that emitted the world’ most in 2006. 接下来,对于图表总况的陈述可以在开头段写(于是,就可以不在结尾段写): Overall, the five countries differed enormously in terms of the average amount of production and the change between 2005 and 2006.
In terms of the individual average, The US and India were most notable, asthey had the maximum (approx. 20kg) and the minimum (1.2kg) respectively, and the emissions of the other countries were within a vast range of 4.8kg to 12kg.
In terms of the total emissions, the US was notable again, asit ranked first in 2005 with nearly 6,000 million tons and, with 5,000 million tons, ranked just below China. The two years also witnessed China’s colossal amounts of emissions of CO2, which were 5,600 million and 6,000 million tons respectively. In Russia, India and Japan, the emissions were at markedly lower levels, between 1,100 million and 1,700 million tons. Meanwhile, the stability in Russia and Japan contrasted sharply with the stark change in the US, China and India (plus 11 percent, minus 15 percent and plus 8 percent).
雅思机经课程中心
查看更多 >雅思快讯
- 雅思考试全球认可度及主要... 2019-05-15
- 雅思考试如何准备?这些内... 2019-04-19
- 收藏!2019年雅思考试日期... 2019-03-06
- 沈阳雅思考试报名条件、流... 2019-04-18
- 沈阳雅思报名身份认证问题... 2022-09-07


