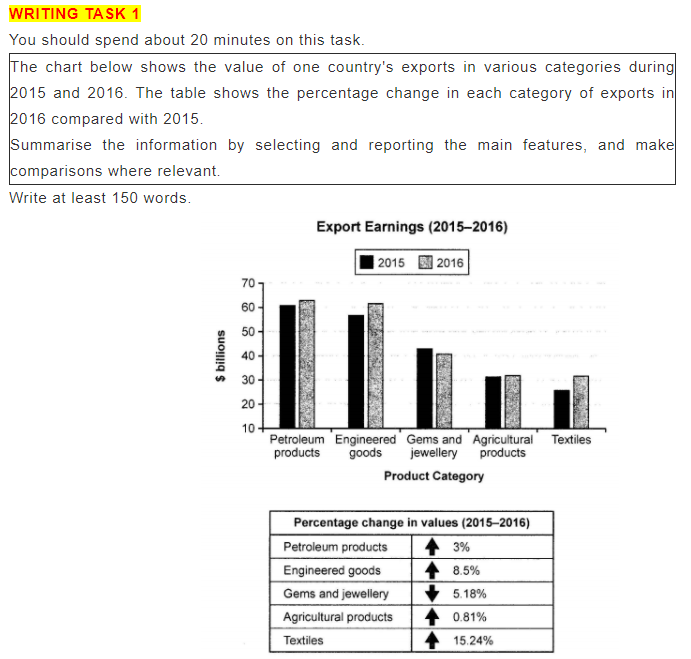
本题出自剑14 Test2的一篇小作文,为柱图和表格的组合图,该图形特点为有时间推移(2015-2016)的动态图,因此在描述数据方面要做到动静结合,即写出数据的动态变化,又要对数据进行对比和比较,结合图形,我们需要分析某国家在2015-2016年间5类商品的出口收入(静态)和变化情况(动态)。
在首段写作时值得注意的是,两个图都要进行概括,尽量同义转述,范文如下:
The chart illustrates a country’s export revenue in a variety of goods in billions of dollars in the years 2015 and 2016. The table represents the changes between the 2 years as a percentage and indicates whether it is a rise or fall.
主体段写作时,我们需要确定主体段时态和分段。本题为描述某国家在2015-2016年间的出口数据变化情况,因此主要时态为一般过去时;另外,常见组合图的分段方式为一图一段,每个主体段描写一个图形的数据,而本题的特别之处在于,两个图形的数据联系紧密,表格中所给数据等同于动态柱图下各产品出口价值在两年间的变化量,所以本题也可以把表格数据与柱图数据进行结合,一同描述,作者在此采取前一种方式进行分段,即一图一段的分段方式。
主体段段的写作顺序为五类商品总体占比从高至低的顺序进行写作,总收入最多且收入上升的petroleum products和engineered goods,其次是收入下降Gems and jewellery,最后为收入上升但是总收入占比最少的商品textiles。根据上述分析,主体段段写作如下:
It can be clearly seen from the bar chart that petroleum products and engineered goods far outstripped(词汇:远超过) the other 3 products, with around $60bn and roughly $58bn in 2015, then rising to about $62bn each in 2016(描述动态数据). Gems and jewellery were firmly in the middle with around $42bn to begin with and then fall slightly the following year, followed by(其次值表达) agricultural products and textiles, with the former remaining steady at around $30bn and the latter showing a $5bn growth, rising to just over $30bn.
主体段第二段的表格,我们从各类商品2015-2016年间收入变化幅度高低进行写作,范文如下:
In terms of percentage change in values, only the figure in gems and jewellery declined by 5.18%. The percentage in the value of textiles rose gigantically by 15.24%, nearly 1.8 times more than that of engineered goods.(倍数表达法) The percentage of value in petroleum products grew by 3%, 2.19% more than(差值比较法)the increase in the percentage of value in agricultural products.
最后结尾段,我们写出动态趋势变化的对比即可:
Overall, most of the sales increased year on year with the exception of gems and jewellery.
对于一般的组合图,即两图数据间联系不大或者几乎没有联系的情况,常采取一图一段的分段方式比较直观。本题的特殊之处在于,虽然为类型不同的组合图(柱表混合),但是两图数据关系可以融合,对于这类数据联系紧密的组合图,我们可以把两图数据进行交叉和融合,而不是按照一图一段的方式写作,各位小烤鸭们要记住喽~